Quantitative reasoning based on the demand history of a good is necessarily linked to the statistical analysis of the data. In this paper, the analysis of historical demand data has been carried out with the use of measures such as:
- the percentile and the quartile,
- measures of central tendency,
- measures of dispersion.
A given set of numbers that are the results of observations can be ordered according to the quantity. Such an arrangement makes it possible to determine the cut-off points of this set.
The P-th percentile in a set of numbers ordered by size is the value below which P of the numbers from this set is located [Aczel 2006]. The place of this percentile is determined by the formula:

where n is the number of items in the set.
The percentiles that divide the collection of quarters are the so-called quartiles:
- the first quartile is the 25th percentile, which is the value below which a quarter of the observation results is located (the so-called lower quartile),
- the second quartile is the 50th percentile, which is the value below which the half of the observation is located (this quartile is also called the median or middle quartile),
- the third quartile is the 75th percentile, which is the value below which three quarters of the observation results are located (the so-called upper quartile).
The difference between the third and first quartiles is called the interquartile distance.
Percentiles and quartiles are measures of the position of selected values in a dataset. Particularly noteworthy here is the median, which lies at the center of the dataset, meaning that half of the results are below and half above this value. The median is therefore a measure of the central tendency of the observation results.
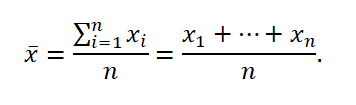
The most commonly used measure of central tendency is the mean value, also called average value, expected value or mathematical hope.
It is the sum of the values of all the results divided by the number of elements of this set and is expressed as a formula:
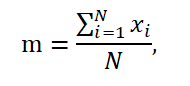
When a set of observation results is the same as a whole population, the mean is denoted by the symbol m and is expressed as a formula:
Apart from the median and the arithmetic mean, the commonly used measure of the central tendency in a dataset is mode, i.e. the value occurring most frequently in a dataset [Aczel 2006].
Dispersion measurements are used to measure the dispersion of the set in relation to the central measurement. One of the measures of dispersion used in this paper is the interquartile distance described earlier, meaning the difference between the upper and lower quartile. Other commonly used dispersion measures are: quartile deviation, range, variance and standard deviation.
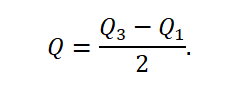
Quartile deviation is a measure of dispersion indicating the range of half of the most typical collectivity units. It is half the difference between the upper quartile, separating the fourth part of the highest units, and the lower quartile, separating the fourth part of the smallest units. The quartile deviation is therefore expressed as a formula:
The range in a set of observation results is the difference between the highest and the lowest value. It is worth noting that in comparison with the interquartile distance, this measure is more sensitive to extreme results.
The variation in the set of observation results is the average square deviation of the results from the mean and is expressed as a formula:
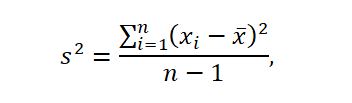
where x ̅ is the average in the sample.
If the data used for the analysis describe the entire population which number equals N, the variance is defined by the formula:
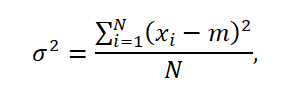
where, m is the average in the population.
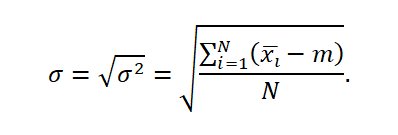
When calculating the variance, the deviations of individual observations from the mean are squared, because summing up and averaging the deviations themselves would give a zero result [Aczel 2006]. This procedure therefore eliminates negative values and the variance does not take on a zero value. As a consequence of raising the individual factors to a square, variance is, however, a measure expressed in square units. Therefore, in order to facilitate the interpretation of the results, the standard deviation, which is the square root of the variance, is used.
The standard deviation in the sample is given by the formula:

The standard deviation in the population is expressed by the formula:
_
Author of the article: Radosław Śliwka